The 9th edition of BARC and Nielsen’s report shows the difference in consumption patterns of consumers from the Pre-COVID period and during-COVID period.
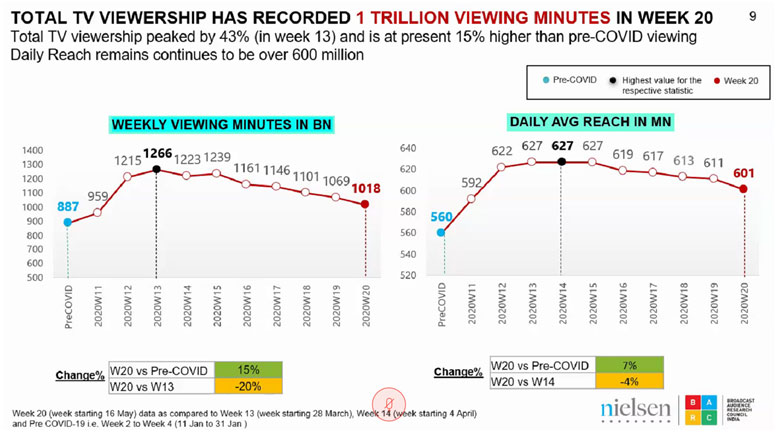
TV recorded a total viewership of 1 Trillion viewing minutes in week 20, daily Average reach in millions saw a 7% increase from Week 20 vs Pre-COVID period followed by the weekly viewing minutes during the pre-Covid-19 period were 887 Bn and 1018 Bn minutes during Week 20. The total number of channels declined by 17% in week 20 versus week 13 and daily ATS grew by 7%.

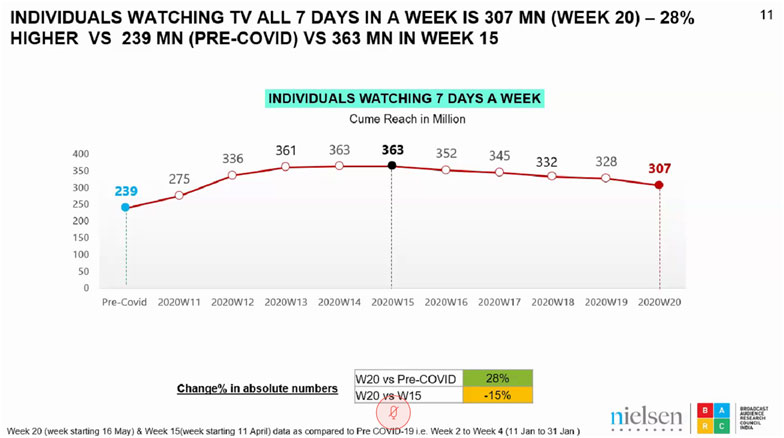
Individuals watching television all 7 days in a week is 307mn in week 20, higher verusu 239mn in pre-covid versus 363mn in week 15, it has declined by 15% in week 20 Versus week 15.

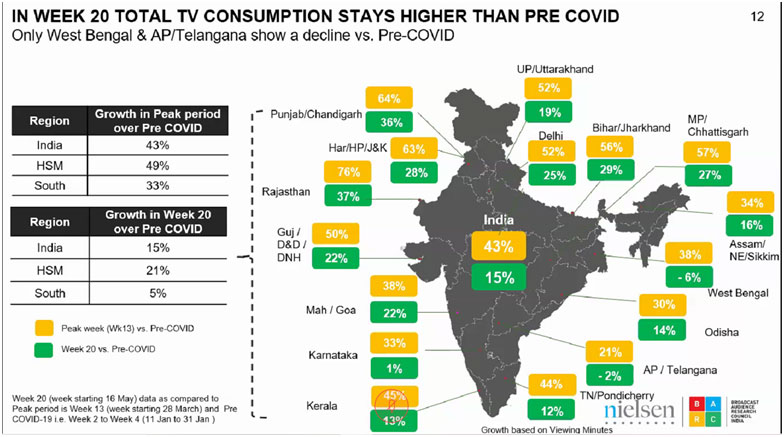
HSM witnesses the highest growth with 49% followed by India with 43%, the decline in week 20 over pre-covid, we get to see that South witnesses the highest decline with 5%.

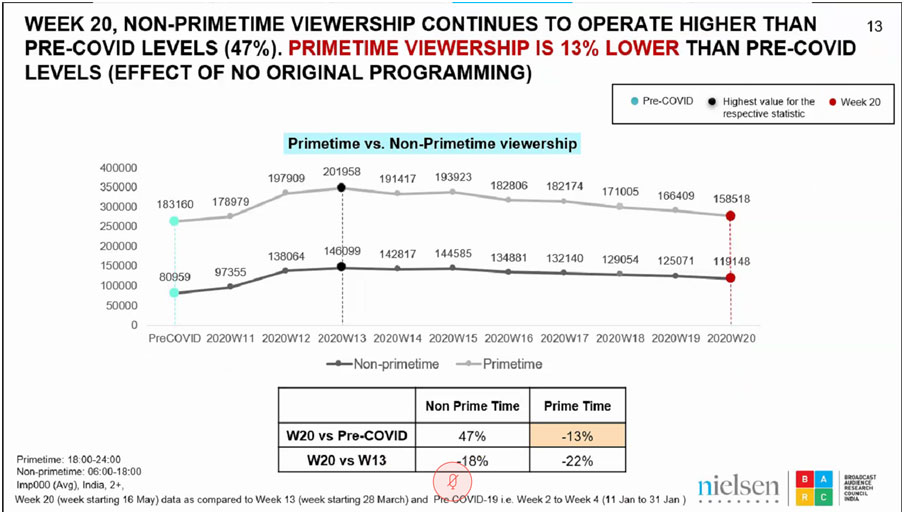
In week 20, non-primetime continues to operate higher than pre covid levels of 47%, while prime time viewership witnessed a fall of 13%.


