The 3rd edition of BARC and Nielsen’s report titled Crisis Consumption: An Insight Series into TV, Smartphones and audiences shows the difference in consumption patterns of consumers from the Pre-COVID period (28th March’20 to 3rd April’20) and during-COVID period (28th March’20 to 3rd April’20).
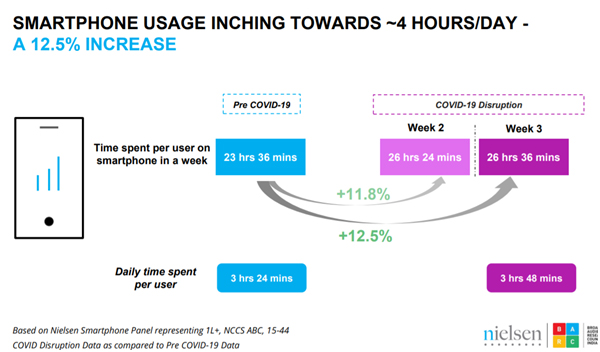
In week 2 of COVID-19 disruption, the time spent on a smartphone had increased by almost 3 hours. In the below-mentioned table, the time spent in week 2 increased by 11.8% and in week 3 it has increased by 12.5% which is a 4 hour increase.
Social Connectivity Stabilizes in Week 3
Chat and VOIP didn’t show any change and remained constant with 98% users in the Pre-COVID period and the COVID disruption week 2 and 3.
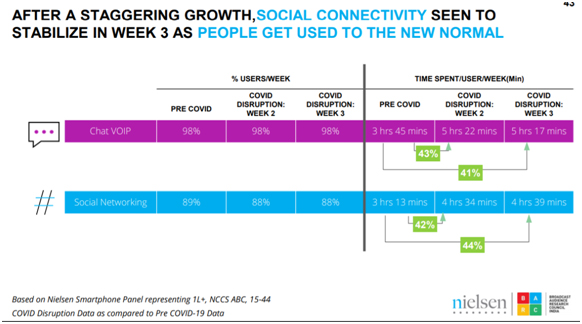
Time spent on Social networking platforms and chatting/VOIP platforms increased. Social Network saw 42% increase from 3 hours 13minutes to 4 hours 34minutes from pre-COVID week to COVID disruption week 2, which then increased to 4 hours 39minutes to week 3. A total increase from Pre-COVID period to week two of the Covid-19 disruption was at 44%.
Mobile Apps achieve the traction
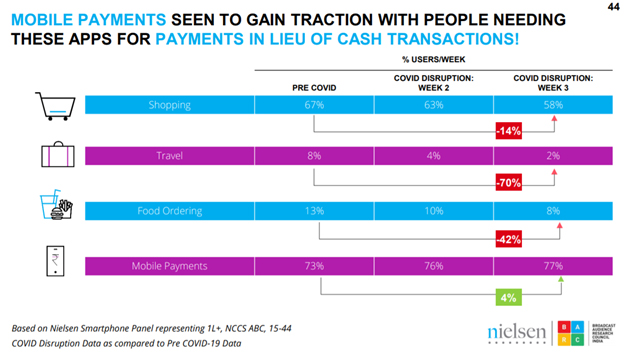
Consumers are using digital payments to buy essential items and services such as food, grocery, medical supplies, telecom recharges, amid the on-going 21-day nationwide lockdown. Mobile Payments witnessed a 4% increase from pre-COVID week to COVID disruption week 3.
Surge in Time Spent on News
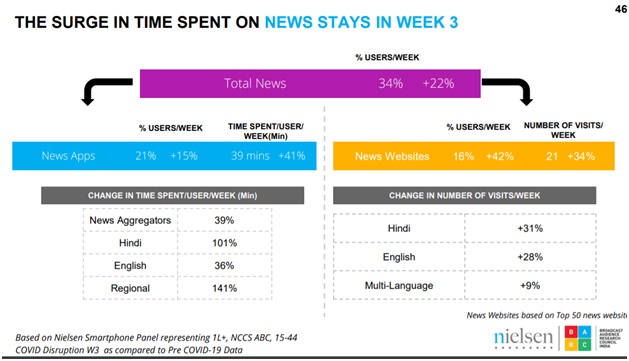
Regional News applications this week too witnessed the highest change in time spent with 141%, followed by Hindi language based applications with 101%. According to the latest data from BARC and Nielsen report, News websites too achieved major growth, with a whopping increase of users to 42%. Hindi news leads the news website category with an increase of 31%.
Movies and Original Series driving the growth for OTT Consumption
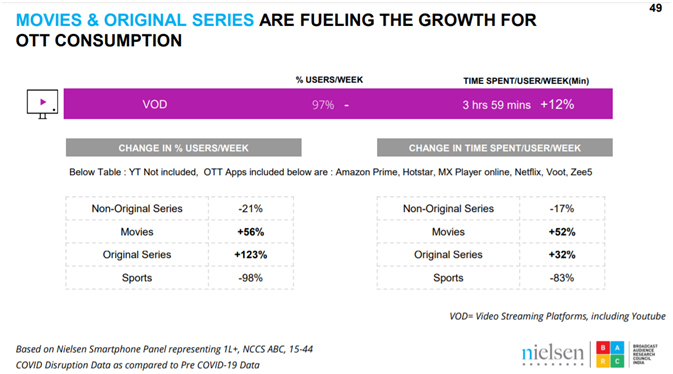
Original Series this week witnessed the highest change in users/week with 123%, followed by Movies with 56%. According to the latest data from BARC and Nielsen report, Time Spend/User/Week witnessed an increase of 12%.
The report also highlighted that 61% of Multi- APP users have shown a change in their top preferred app in week 3.
This research is based on Nielsen Smartphone Panel representing 1L+, NCCS ABC, 15-44

