The TAM AdEx-Television Advertising Report VII for period Apr-Jul’20*, the Part 1 of the report talks about the Overall Television Advertising during Jun-Jul’20*.
Advertising on Television during Jun’20-Jul’20*
- 2,100+ Advertisers and 3,400+ Brands visible across 350+ Categories
- 48,000+ hrs. of advertising volumes on Television in Jun-Jul’20*
- Average Ad Volumes/Day in Jul’20* grew by 5% compared to Jun’20.
Week on Week TV Ad Volumes
Comparing week 29 to week 23, 37% growth in Television Ad Volumes, Week 29 observed highest Ad Volumes among weeks ranging from 23 to 29 except Wk. 26 and Ad Volumes on TV for last 5 weeks were above average Ad Volume of Wk. 23-29.
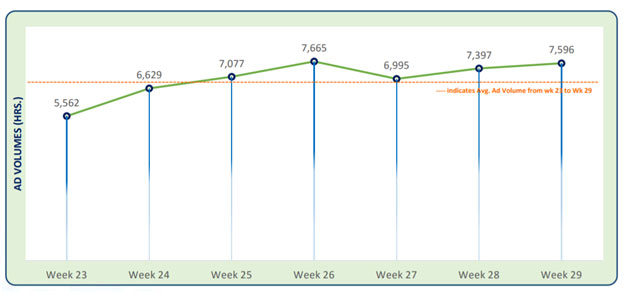
Average Ad Volumes/Day: Jun-Jul’20*
Avg. Ad Volumes/Day for the month of Jul’20* grew by 5% over Jun’20.

Top Sectors and Categories
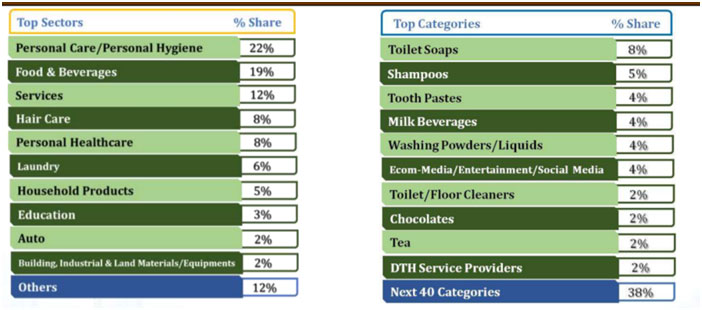
Sector ‘Personal Care/Personal Hygiene’ topped with 22% share followed by F&B sector, the list of top 10 categories was dominated by FMCG sector and the top 50 categories holds 75% share of TV Ad Volumes.
Top Advertisers
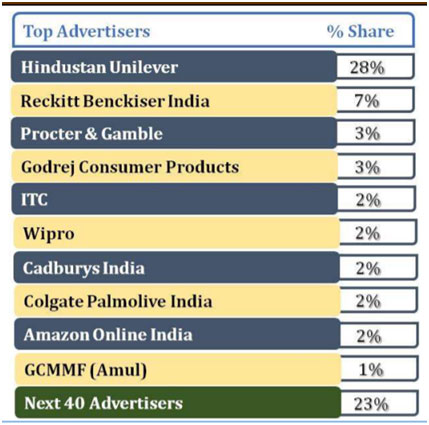
During Jun-Jul’20*, the Top 10 advertisers together contributed 50% share of TV Ad Volumes. ‘HUL’ alone had more than 1/4th of the Ad Volume share followed by ‘Reckitt’ with 7% share.
No of Categories, Advertisers and Brands
A stable trend in tally of categories, advertisers and brands during last 7 weeks, 2% rise in avg. number of advertisers and brands during week 28-29 compared to week 23-27. Week 27 saw maximum number of advertisers and brands.

New* Advertisers and Brands each week
19% growth in tally of new advertisers in week 29 compared to week 28, no. of new brands grew by 8% in week 29 over week 28.
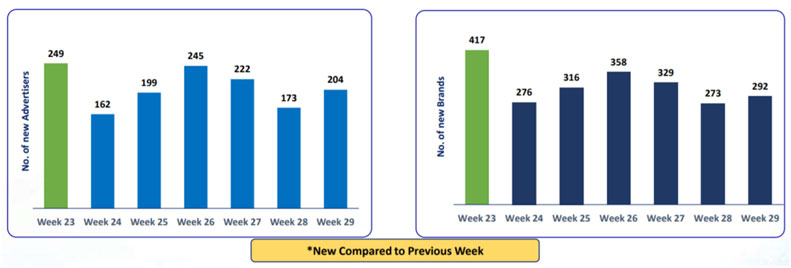
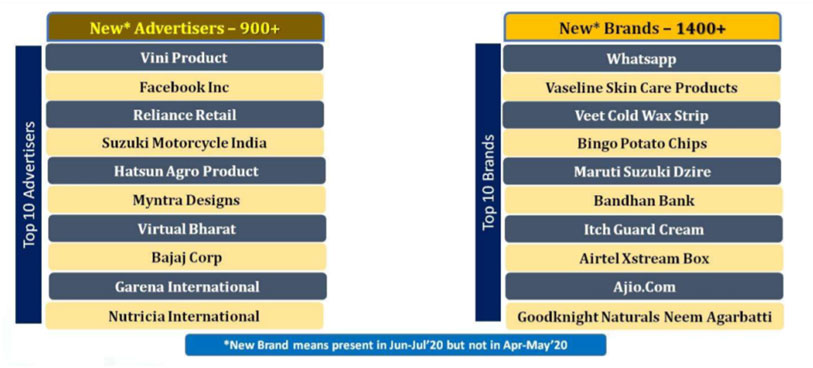
New* Advertisers and Brands on TV: Jun-Jul’20
Total 900+ New Advertisers and 1400+ new brands seen in Jun-Jul’20 over Apr-May’20, Vini Product topped list of new Advertisers and Whatsapp leads among new brands.
